Jirka, how would you describe your role in OKIN Facility?
My work is divided between two main areas. The first is the support of the Drive mobile app, which is used to record tasks and activities in the context of technical maintenance. The second area is the management of our in-house tool Cleaning Control, which is a system for tracking the attendance of cleaning staff at work. In both cases it is about working with data, analysing it, evaluating it and modifying the system, but in the case of Cleaning Control it is also about managing the readers.
If I understand correctly, does that mean you’re also in charge of the hardware?
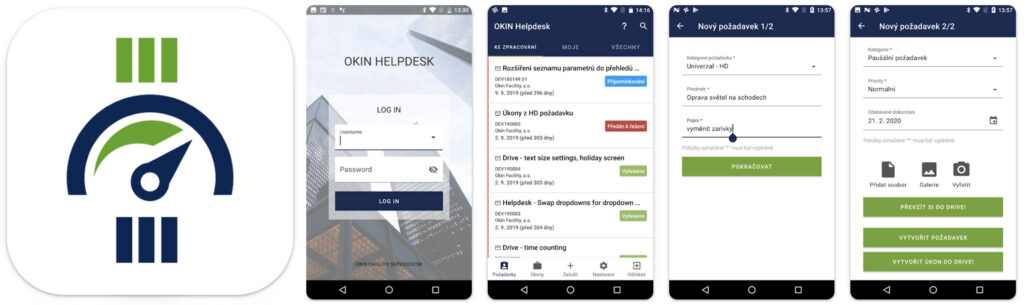
That’s right. With Drive, it is about user support and data analysis. We evaluate, for example, the time of tasks, their completion and then the so-called events, such as travel time or work on the PC. For example, if users solve a problem with an application, they contact the IT Helpdesk or call me directly, depending on the nature of their problem.
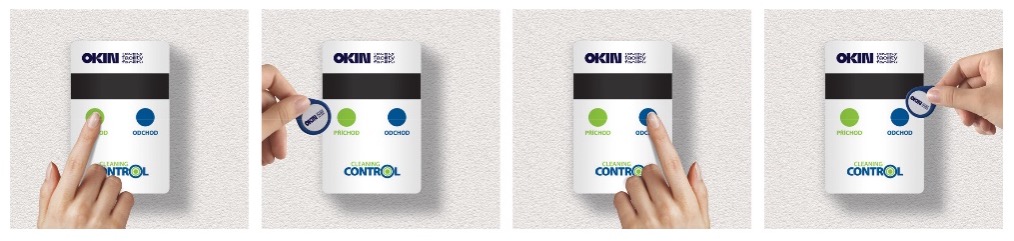
At Cleaning Control, I am mainly responsible for managing readers, deploying them, setting up new clients and occasional repairs. Data collection is automatic, but from time to time it is necessary to perform some specific intervention. For example, in cases where a cleaner or worker accidentally „beeps“ twice to check-in instead of „check-in/out“. This then needs to be manually adjusted in the system. However, this is nowadays mostly handled by facility managers directly in the operation.
This also brings us to the last major modification of the entire system, which brought a major simplification of working with Cleaning Control, which was its recent update to version 2.0. Its biggest advantage is that the vast majority of tasks can now be monitored directly by people on specific sites, and the frequent intervention of a technical administrator is no longer necessary.
Another area I’m involved in is data analysis that happens on what we call the “layer above the base data.” We display these using a specific dashboard or within our Service Desk. If I should name an example of this type of data processing and visualization, we have recently prepared a dedicated dataset for our client, a major player in the mobile telecommunications services segment, which we could then conveniently display as a dashboard in the Service Desk. But this also applies to regular dashboard outputs such as Jasan Clean.
What technologies do you work with in Cleaning Control?
We use two main technologies or networks. One is based on GSM, but this will be ending by 2027 at the latest, as it is a historic mobile network that mobile operators are trying to close. The other network in use is NarrowBand IoT, and we are also using the LoRa network to a lesser extent. We also used to have Sigfox, but that has also been down for some time. Of course, the discontinuation of Sigfox was also linked to the replacement of the readers for this system.
Is there any other line of data you’re looking at
Definitely. We also track data on service intervals and revisions. This is very important, particularly from a legislative point of view, and we monitor in particular whether all the statutory deadlines are met, when an inspection or service has been carried out on a particular piece of equipment, or even whether an inspection is so-called lapsed.
The report is then sent to all countries where OKIN Facility operates, again in the form of a dashboard that I prepare in Power BI. The dashboard displays data from the Drive mobile app (tasks), revisions and service and requests from our Help Desk.
You also work with data from client satisfaction surveys, right?
Yes, I transform raw data from SurveyMonkey into a clear, user-friendly format so that colleagues can work with it easily. For several years now, we’ve been regularly collecting feedback on client satisfaction with OKIN Facility’s services. Since the standard output from SurveyMonkey was often unclear and difficult to analyze, we began transforming the data before visualizing it.
We’ve just completed another round of our client satisfaction survey, and the dashboard we now use to display the results has become quite sophisticated. It presents dozens of key data points — including breakdowns by country or contract – and even allows us to track satisfaction levels with individual contract managers.
What are the biggest challenges in implementing data solutions?
Above all, to convince people that data is not a means to control, but rather a means to greater efficiency. I know I’m speaking generally, but from my own experience – and from conversations with colleagues in the industry – I often see entire analyses end up in a “dead end.” Why? Because users simply don’t want to change their habits. But in the end, its all about the mindset. The goal of any meaningful and well-designed data analysis is, first and foremost, to save people time and energy. A typical example is tracking how frequently employees move through certain areas. Over time, this data helps optimize the allocation of cleaning services — focusing efforts where they’re truly needed and reducing unnecessary cleaning in unused rooms or spaces. It is also important to keep the data output as simple as possible. This is the basis. Ideally, literally everyone should understand the data and its interpretation, because only then will people have absolute confidence in it and not doubt its usefulness.
Is there a myth about data analytics that particularly drives you crazy
That’s what „ocometric management“ is. People think they know how their teams work and they don’t need numbers. But without data, we make decisions based on perception, not reality.
How did you get into data analysis in the first place?
I studied geoinformatics at the Technical University of Ostrava and there were basically three different directions to go in this field of study. The first one was programming, the second one focused on databases, and the third one, which was sort of in between the two previous ones, was data analysis. And I was already drawn to databases and analytics during my studies. My first role after graduating was as a data analyst in the banking sector in 2008, which means I’ve been working in this field for 17 years. In the bank, I was very much in the so-called call process or back office sector, which incidentally has a lot to do with the maintenance data collection in Drive, especially the regular, repetitive procedures that need to be followed. I have been working for the OKIN group since 2016 and exclusively for the OKIN Facility since 2018. Incidentally, joining OKIN is linked to a very nice personal event, as my daughter was born in 2016.
Now the question that comes to my mind is whether data in facility management is any different from data in other industries?
It’s always all about perfect knowledge of the process in question, because the data analyst must know perfectly what’s behind each specific number. Only then can he interpret them correctly. Working with numbers as such is still basically the same, but the difference may be in the tools used to measure them and the databases.
What to do to make data analytics really deliver results?
We need to collect quality data, analyse it clearly and, above all, implement it effectively back into practice. Unfortunately, the last part is often missing. And without it, data loses its meaning and usefulness. The ability and willingness to „pull together“ is also an absolute prerequisite, because if any link in the chain considers data analysis to be useless or perhaps even a waste of time, it can never work out well.
Do you have a favourite analytical tool?
Databases are definitely the basis. We mostly use Microsoft SQL Server, then of course Excel, which is such a classic and above all universal worker. We use it a lot. I am also interested in Python, mainly because of the new possibilities it offers. A big visualization potential is Power BI, which I consider to be a very important tool for the present, but even more so for the future in my work, given the implementation of artificial intelligence elements.
What do you consider to be the biggest benefit of working at OKIN Facility?
For me personally, it’s definitely the ability to work from home, i.e. home office. It saves me a lot of time, and given that I’m quite concerned about climate and environmental issues, I also welcome the significant reduction in my personal carbon footprint in the time I’ve been working from home. But on the other hand, it must be added that a home office person must also have a certain internal setup and sense of responsibility. All of this, coupled with good time management.
What do you do to „recharge your batteries“
Lately, it’s mainly bike rides around our area and then skiing in the winter. We’ve been going with the whole family because both my kids really enjoy skiing, which makes me very happy. And I’m also interested in the stock market, securities, and I certainly can’t leave out cryptocurrencies like Bitcoin, Ethereum, Cardano and a few others. But that’s more of an evening’s entertainment. One is always learning.